Data Display
Deprecated since version 6.4.6.0:  FrDisplay has been removed from cWB and will not be available in cWB 6.4.7.0 and
later versions.
FrDisplay has been removed from cWB and will not be available in cWB 6.4.7.0 and
later versions.
This page provides a description of the FrDisplay tool. Further documentation on the FrDisplay tool is available at the following links:
Overview
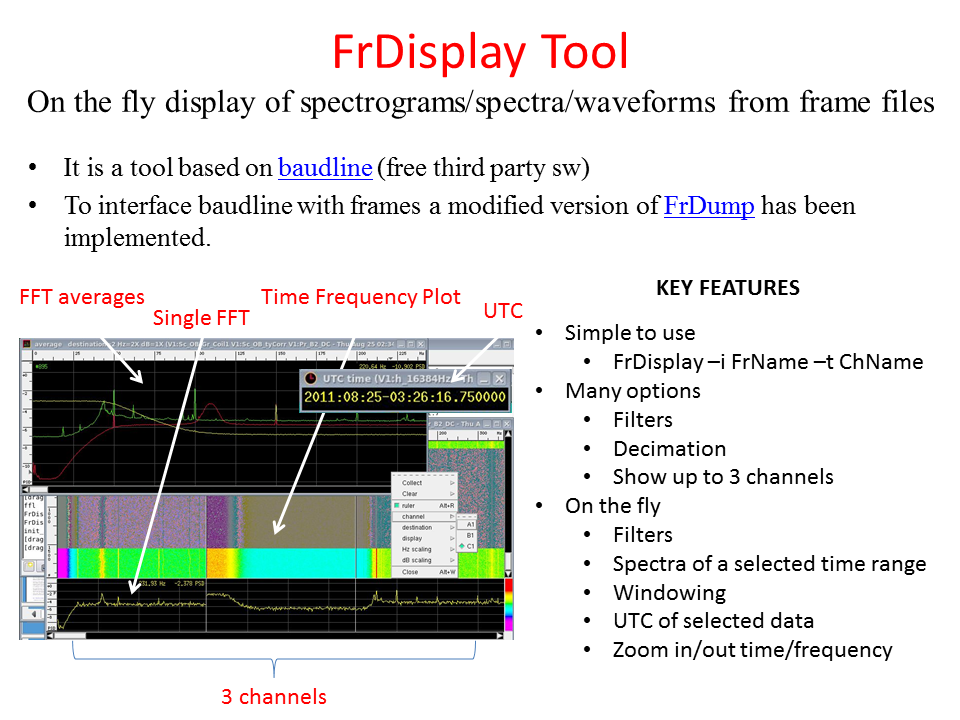
The FrDisplay tool enables the plotting of spectrograms, spectra and waveforms from data contained in frame files. It wraps the considered frame files and Baudline, a software developed for data visualization in the time-frequency domain. FrDisplay can also be used to list the channels available in the considered frames, see this page: How to dump the frame file contents.
Warning
Baudline is no longer maintained, the latest version dates back to 2013, only the executable is available and still works.
A graphical overview of the FrDisplay tool is provided by the following image:
Examples

The following command lines are examples of how to use the FrDisplay tool (see here for the meaning of PROC and ADC):
Help Commands:
list of ligo_data_find data_type (only for ATLAS & CIT)
FrDisplay -i ldf -s help
baudline list of parameters
FrDisplay -x help
filter help
FrDisplay -k help
How to control baudline display:
Data are sent to baudline in a continuous way until the end of last frame.
To stop the flow of data, select the baudline window and press space;
to resume, press space again.
To exit, select the command line window and press CTRL-C and type 'y'.
Note: some time is necessary to press CTRL-C 2 times.
To save the baudline picture in png format, select the command line window and press CTRL-C and type 's',
then select the baudline window to be saved. The picture is saved in the current directory
with the name reported in the command window.
If the exit command does not complete successfully use the command kbaudline or kFrDisplay
Display of Proc Data:
There are different ways to access frame data
by file name (same syntax as FrDump)
FrDisplayPROC -t H1:LDAS-STRAIN -i /atlas/data/d14/LSC/H/95560/H-H1_LDAS_C02_L2-955609344-128.gwf
FrDisplayPROC -t G1:DER_DATA_H -i /atlas/hsm/GEO/h/RDS3/frames/2011/day155/hour18/G-G1_RDS_C01_L3-991247*.gwf
by ffl file list
FrDisplayPROC -t H1:LDAS-STRAIN -i $FRDISPLAY_DIR/ffl/h1_atlas.ffl
by ligo_data_find command (embedded in the FrDisplay)
FrDisplayPROC -t H1:LDAS-STRAIN -i ldf -o H -s H1_LDAS_C02_L2 -f 955609344 -l 955609544
It is possible to list the channels present in the frame file
FrDisplayPROC -i ldf -o H -s H1_LDAS_C02_L2 -f 955609344 -l 955619944
FrDisplayPROC -i /atlas/data/d14/LSC/H/95560/H-H1_LDAS_C02_L2-955609344-128.gwf
It is possible to display a channel using the channel number of the list
FrDisplayPROC -i /atlas/data/d14/LSC/H/95560/H-H1_LDAS_C02_L2-955609* -t 3
Display of Adc Data:
If there are many channels in the frame file, it is possible to show up to 3 channels simultaneously
NB: the scale normalization of the 3 channels is set to the same level !!!
FrDisplayADC -t "V1:Sc_OB_Gr_Coil1 V1:Sc_OB_tyCorr V1:Pr_B2_DC" -i /home/vedovato/frames/V1_RAW_TST/V-raw-986188050-150.gwf
It is possible to list the channels present in the frame file
(NB! only channels with sample rate>50Hz)
FrDisplayADC -i /home/vedovato/frames/V1_RAW_TST/V-raw-986188050-150.gwf
Apply Filters to Data:
The dynamic range of baudline is 16bit, so to avoid signal distortions it is necessary to apply a high pass filter to the data
to pass the filter parameters use the key -k
Ex: -k "-Bu -Hp -o 6 -a 50"  is a HighPass (-Hp) Butterworth (-Bu) filter of order 6 (-o 6) with a corner frequency 50Hz (-a 50)
For more options see the mkfilter manual
FrDisplayPROC -t G1:DER_DATA_H -i ldf -o G -s G1_RDS_C01_L3 -f 991247040 -l 991248040 -k "-Bu -Hp -o 6 -a 50"
Apply Baudline options to Data:
It is possible to pass the baudline parameters from the FrDisplay command line using the key -x
Ex: -x "-decimateby 4 -downmix 600 -decimategain 48"  : data are decimated by a factor 4, the new start freq is 600Hz and the amplitude gain is 48dB
FrDisplayPROC -t H1:LDAS-STRAIN -i ldf -o H -s H1_LDAS_C02_L2 -f 955609344 -l 955619944 -x "-decimateby 4 -downmix 601 -decimategain 48"
The gain of the data is selected to obtain the best visualization in baudline
If the user wants to apply a different gain use the option -uscaleby
Ex : -x "-uscaleby 0.5" - the gain is divided by 2
FrDisplayPROC -t H1:LDAS-STRAIN -i ldf -o H -s H1_LDAS_C02_L2 -f 955609344 -l 955619944 -x "-uscaleby 0.5"
For more options see the baudline online manual
tools/frdisplay/README.*